GEONE - DEESSE - Using a mask
Import what is required
[1]:
import numpy as np
import matplotlib.pyplot as plt
import time
import os

# import package 'geone'
import geone as gn
[2]:
# Show version of python and version of geone
import sys
print(sys.version_info)
print('geone version: ' + gn.__version__)
sys.version_info(major=3, minor=13, micro=7, releaselevel='final', serial=0)
geone version: 1.3.0
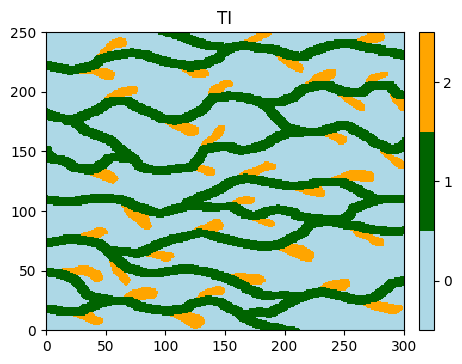
Training image (TI)
[3]:
# Read file
data_dir = 'data'
filename = os.path.join(data_dir, 'ti.txt')
ti = gn.img.readImageTxt(filename)

# Values in the TI
ti.get_unique()
[3]:
array([0., 1., 2.])
Plot the image (using the function geone.imgplot.drawImage2D).
[4]:
# Setting for categories / colors
categ_val = [0, 1, 2]
categ_col = ['lightblue', 'darkgreen', 'orange']

plt.figure(figsize=(5,5))
gn.imgplot.drawImage2D(ti, categ=True, categVal=categ_val, categCol=categ_col, title='TI')
plt.show()
Simulation grid and mask
Deesse requires a regular cartesian grid. However, one can specify to deesse to not simulate every cell in the simulation grid. For that, a mask is used: a value (0 or 1) is attached to each simulation grid cell indicating that the cell must be simulated (value 1) or not (value 0). These values are passed to deesse by an array.
[5]:
# Read the mask (image) from the file 'mask.txt'
data_dir = 'data'
filename = os.path.join(data_dir, 'mask.txt')
mask = gn.img.readImageTxt(filename)

# Set the simulation grid
nx, ny, nz = mask.nx, mask.ny, mask.nz
sx, sy, sz = mask.sx, mask.sy, mask.sz
ox, oy, oz = mask.ox, mask.oy, mask.oz

# Set mask values to simulation grid cells (1: cell to be simulated)
mask_value = mask.val
Fill the input structure for deesse and launch deesse
[6]:
deesse_input = gn.deesseinterface.DeesseInput(
    nx=nx, ny=ny, nz=nz,
    sx=sx, sy=sy, sz=sz,
    ox=ox, oy=oy, oz=oz,
    nv=1, varname='categ',
    TI=ti,
    mask=mask_value,          # set mask
    distanceType='categorical',
    nneighboringNode=24,
    distanceThreshold=0.02,
    maxScanFraction=0.25,
    npostProcessingPathMax=1,
    seed=444,
    nrealization=1)

# Run deesse
t1 = time.time() # start time
deesse_output = gn.deesseinterface.deesseRun(deesse_input)
t2 = time.time() # end time
print(f'Elapsed time: {t2-t1:.2g} sec')
deesseRun: DeeSse running... [VERSION 3.2 / BUILD NUMBER 20230914 / OpenMP 19 thread(s)]
deesseRun: DeeSse run complete
Elapsed time: 0.92 sec
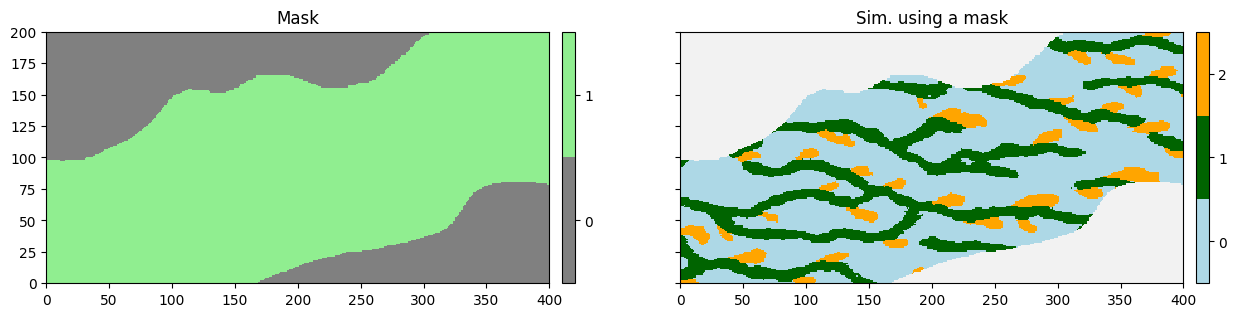
Display the “mask” and the simulation
[7]:
# Retrieve the result
sim = deesse_output['sim']

# Display
plt.subplots(1, 2, figsize=(15,5), sharey=True) # 1 x 2 sub-plots

# ... the mask
plt.subplot(1, 2, 1)
gn.imgplot.drawImage2D(mask, categ=True, categCol=['gray', 'lightgreen'], title='Mask')

# ... the simulation
plt.subplot(1, 2, 2)
gn.imgplot.drawImage2D(sim[0], categ=True, categVal=categ_val, categCol=categ_col, title='Sim. using a mask')

plt.show()